See where the hours and money go
Labour cost and coverage, in plain numbers.
Scheduled vs worked hours, overtime, labour cost against budget and fairness. The numbers you need to run a floor, without a data-science project.
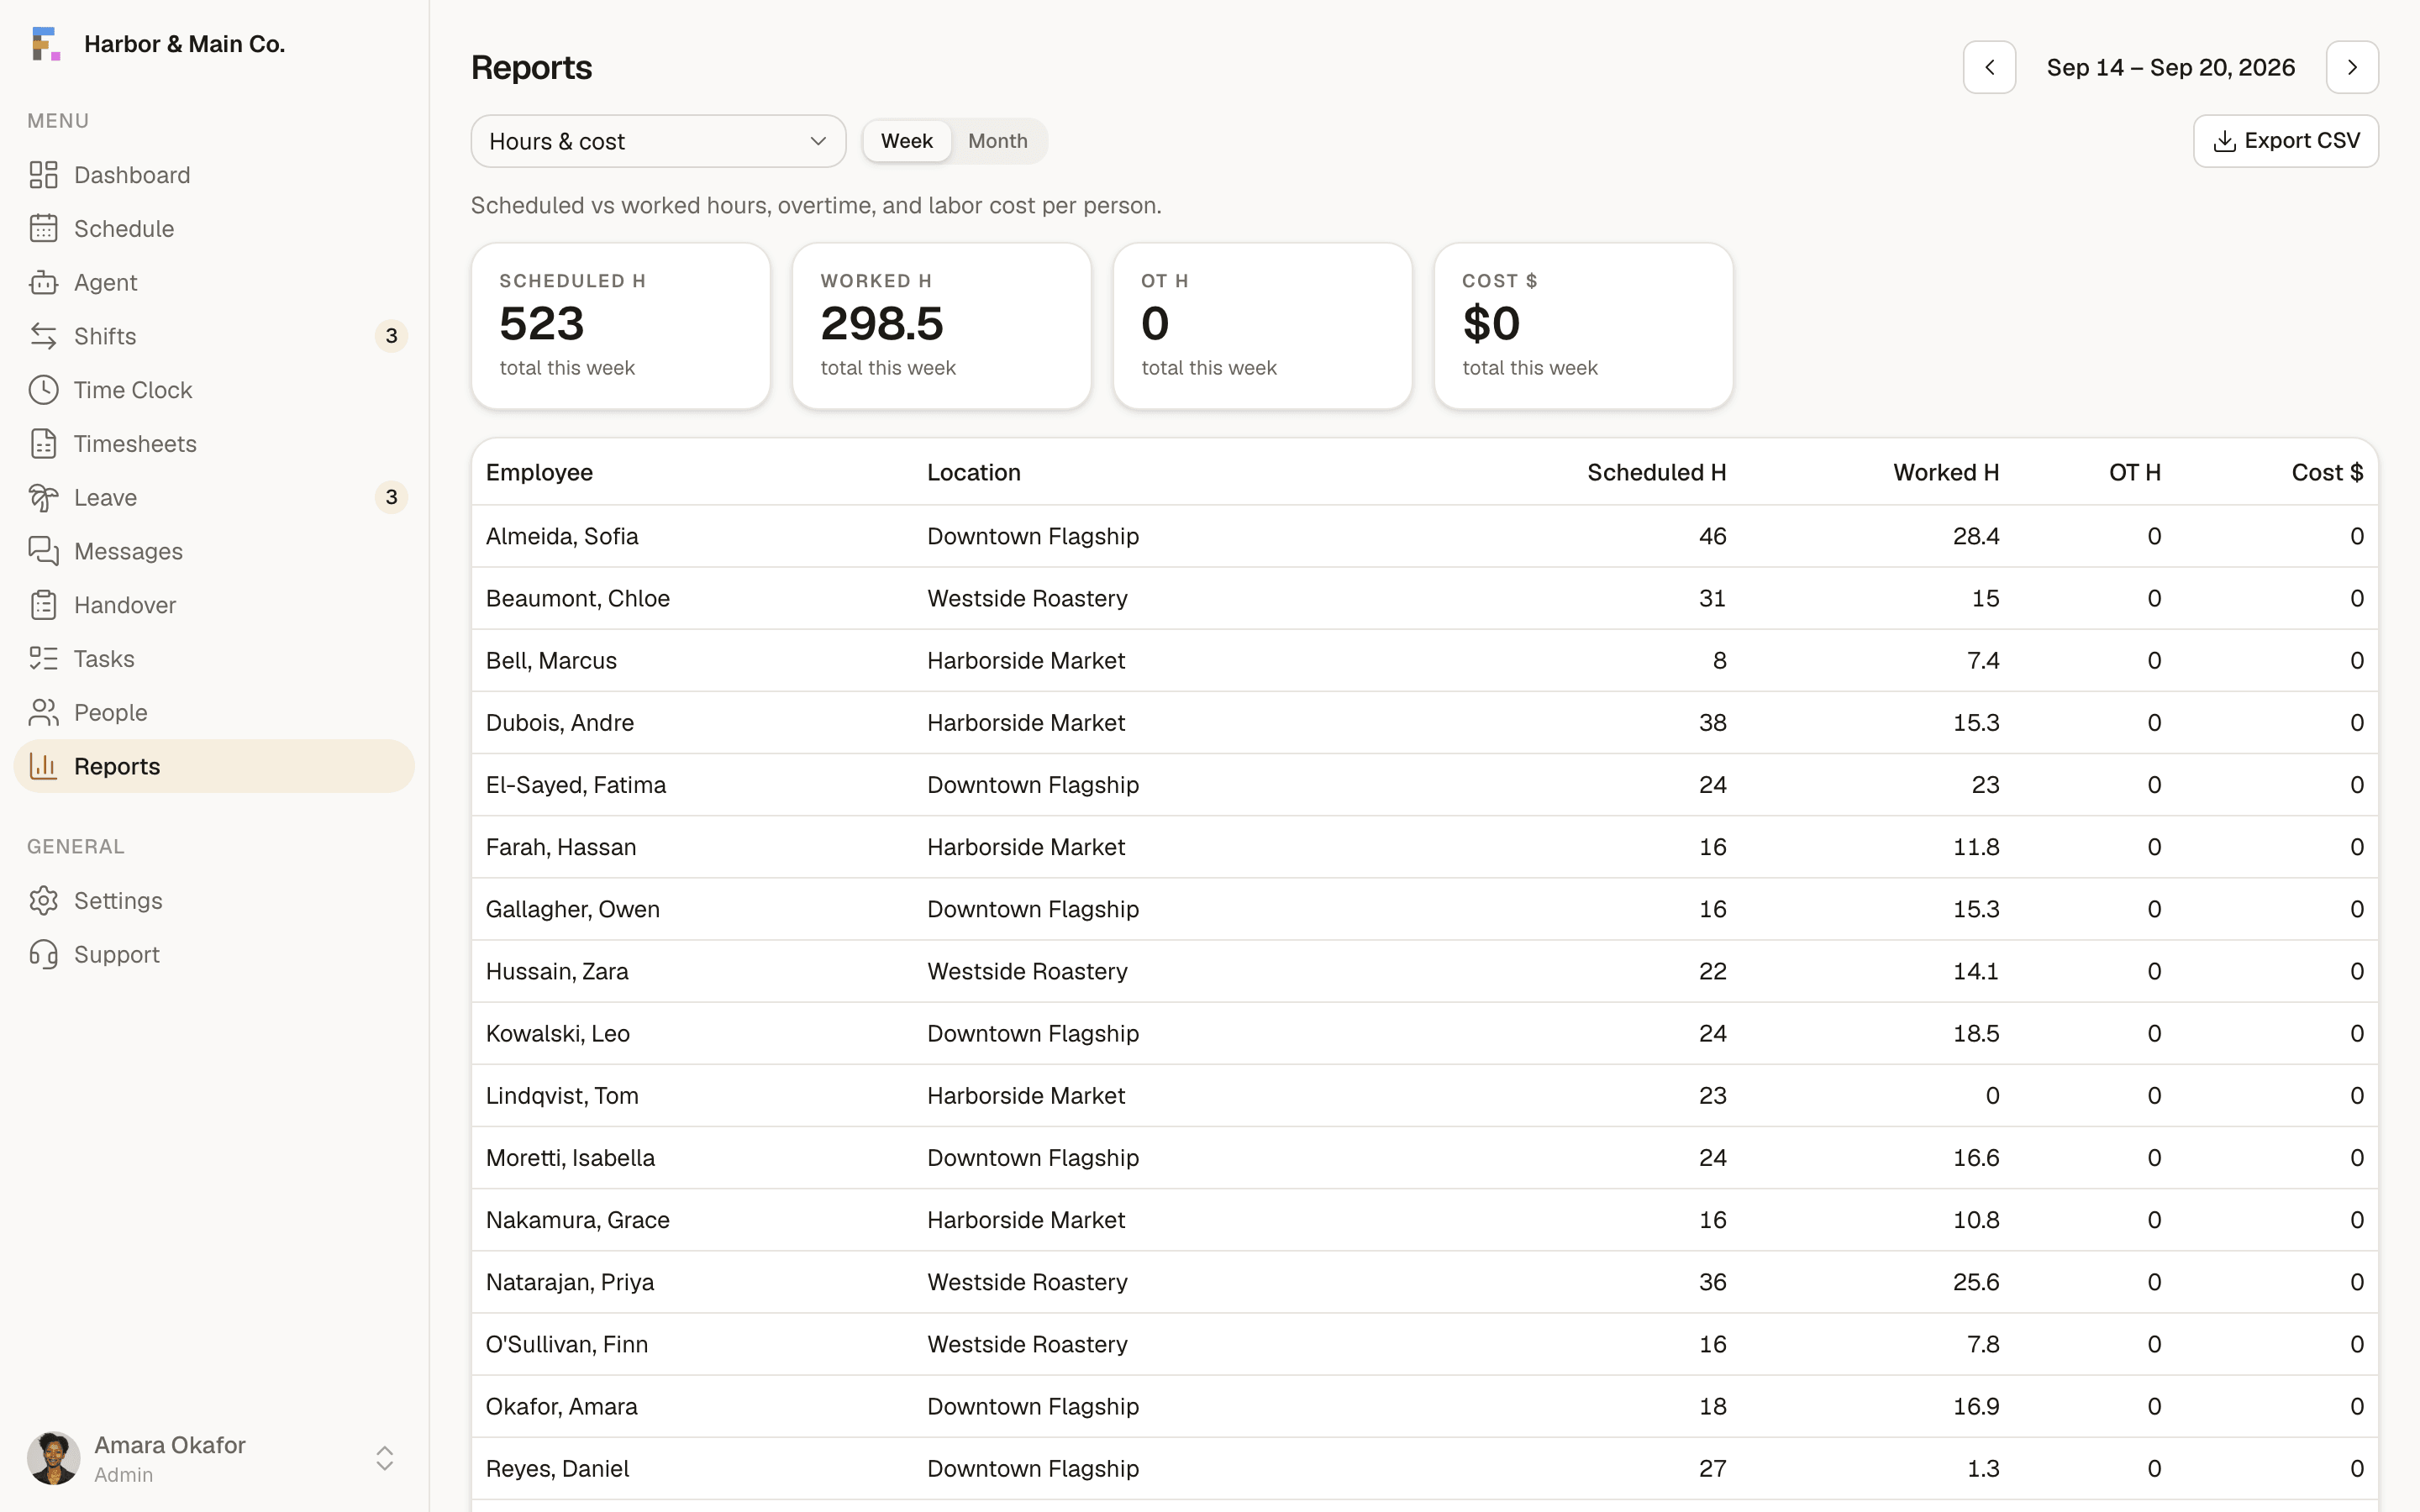
Labour vs budget
See scheduled cost against budget per location and week, so you catch overspend before it lands.
- Scheduled vs worked hours and overtime per person, ready to export for payroll or review.
Fairness score
Coverage & no-show risk
Reports & insights, answered.
Do I need to build dashboards?+
Can I export the data?+
What is the fairness score?+
The terms behind this feature.
Plain definitions for the words that show up when you run shifts, each one written to answer the question on its own.
Written up, from the floor.
How operators actually handle this, what it costs when it goes wrong, and where the trade-offs really sit.
- Reading Your Labour Cost PercentageThe most quoted number in shift work, and the easiest to misread. What goes into it, and what it can honestly tell you.
- Where Labour Savings Actually Come FromIt isn't magic. Here's the breakdown of where autonomous scheduling recovers cost, and where it honestly doesn't.
More of the platform
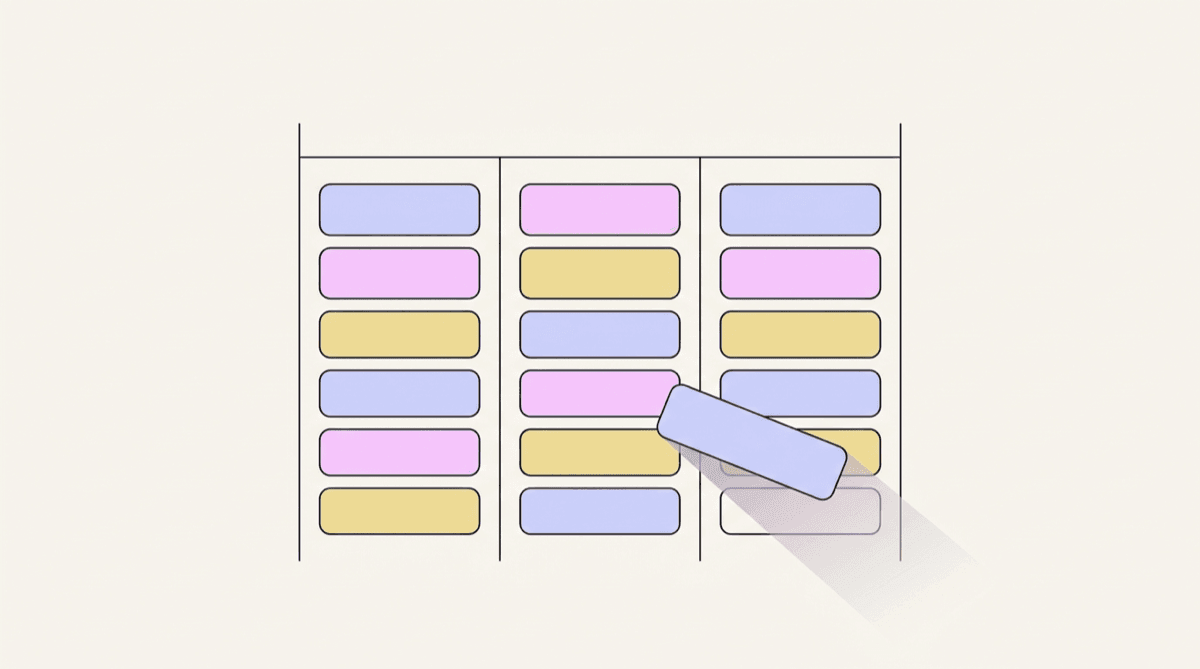
Scheduling
A drag-and-drop week grid where every position has its own colour, coverage gaps are visible, and templates seed the whole thing from your industry.
Explore scheduling
Time clock
Kiosk PIN clock-in with an optional verification photo, a live on-the-clock board and break tracking, so hours are real rather than remembered.
Explore time clock
Timesheets & payroll
Worked hours, breaks and overtime roll up automatically per period, with flags for anything that needs a human. Then export a clean CSV.
Explore timesheets & payrollSee it with your own schedule
Set up a workspace, add your team, and build a week. It takes about ten minutes and costs nothing.
Start free